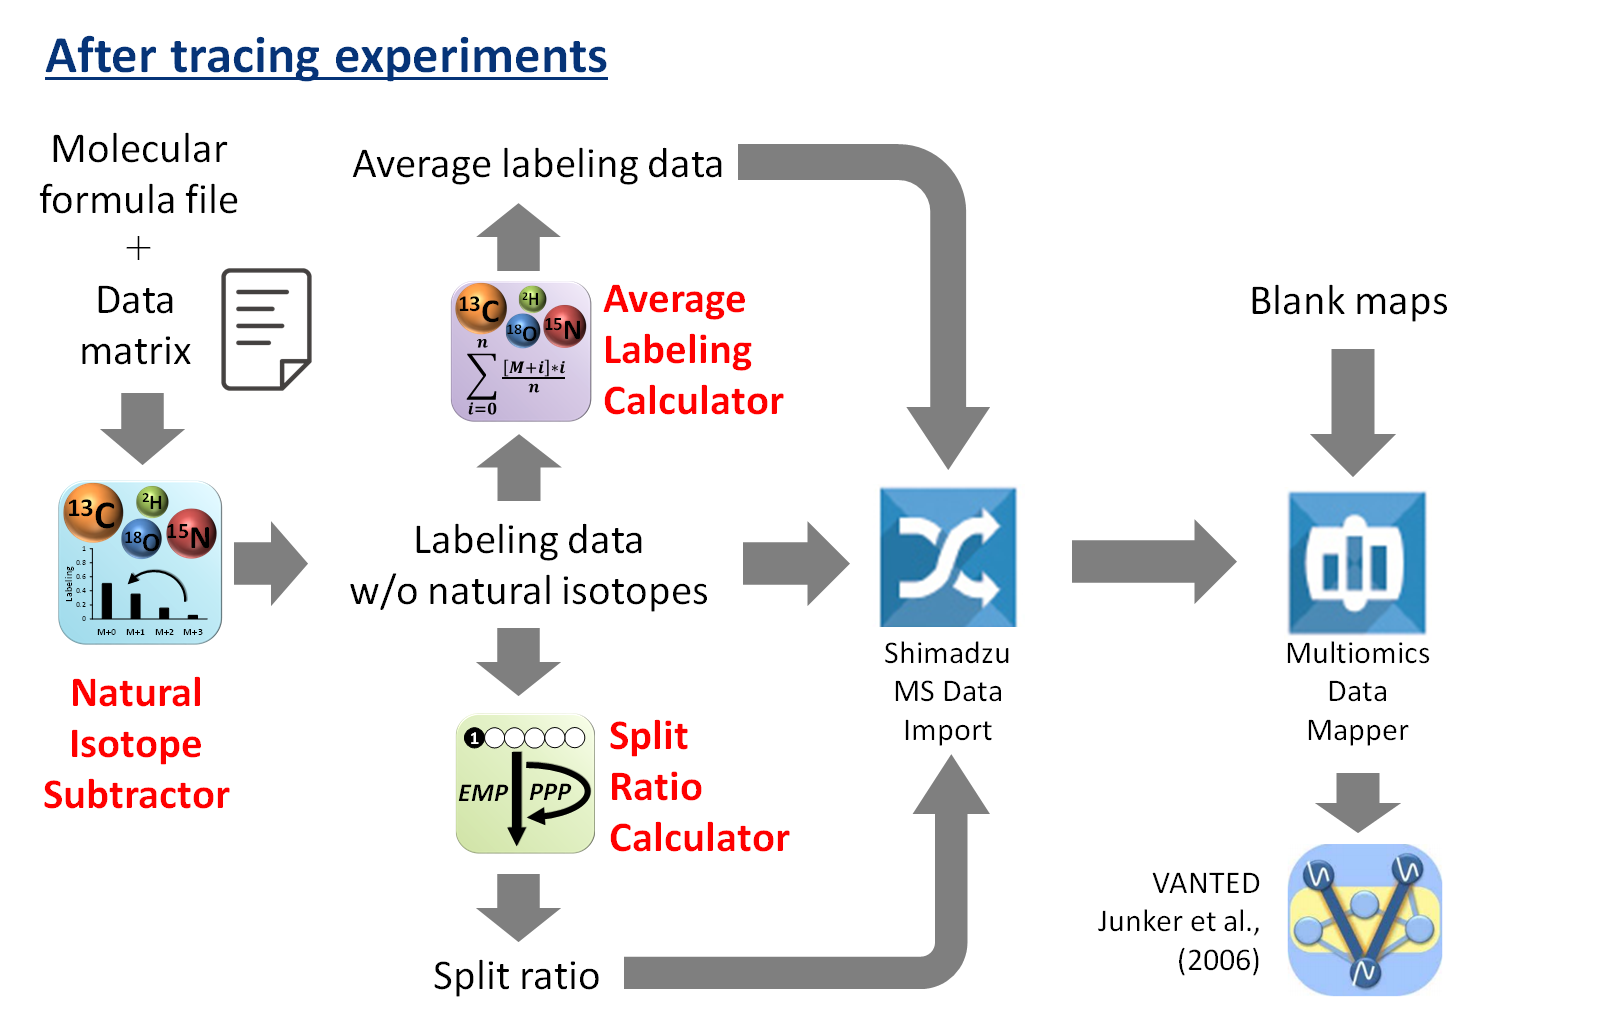
Processed data by "Isotope Calculation Gadgets" can be visualized on blank maps by using "Shimadzu Multi-Omics Analysis Gadget Pack" and "VANTED".
Preparation
Obtain natural isotope-subtracted labeling data by using "Natural Isotope Subtractor".
Procedure
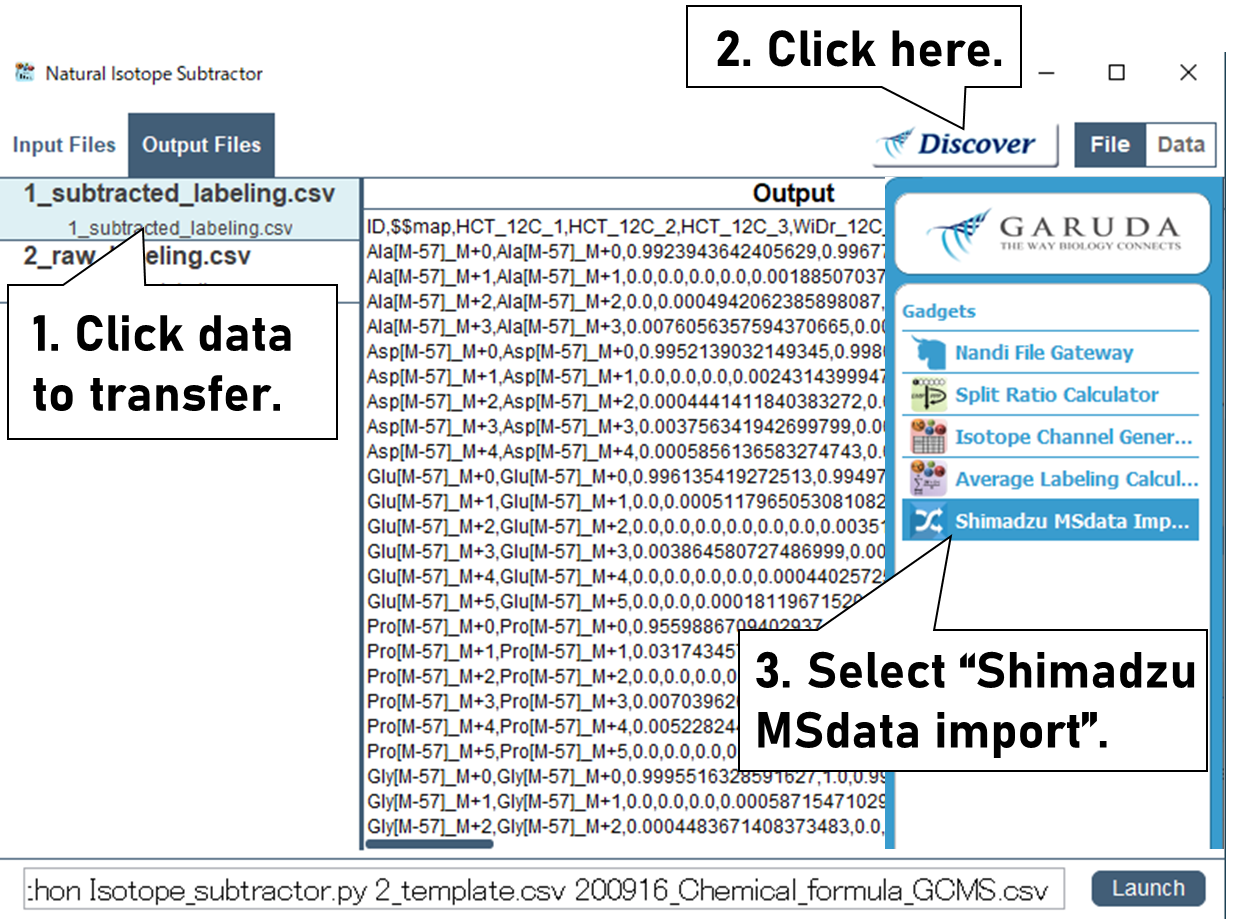
Click data to visualize, then click "Discover" Button. Select "Shimadzu MSdata import."
Note:
Click "Fluxomics" button in the pop-up window.
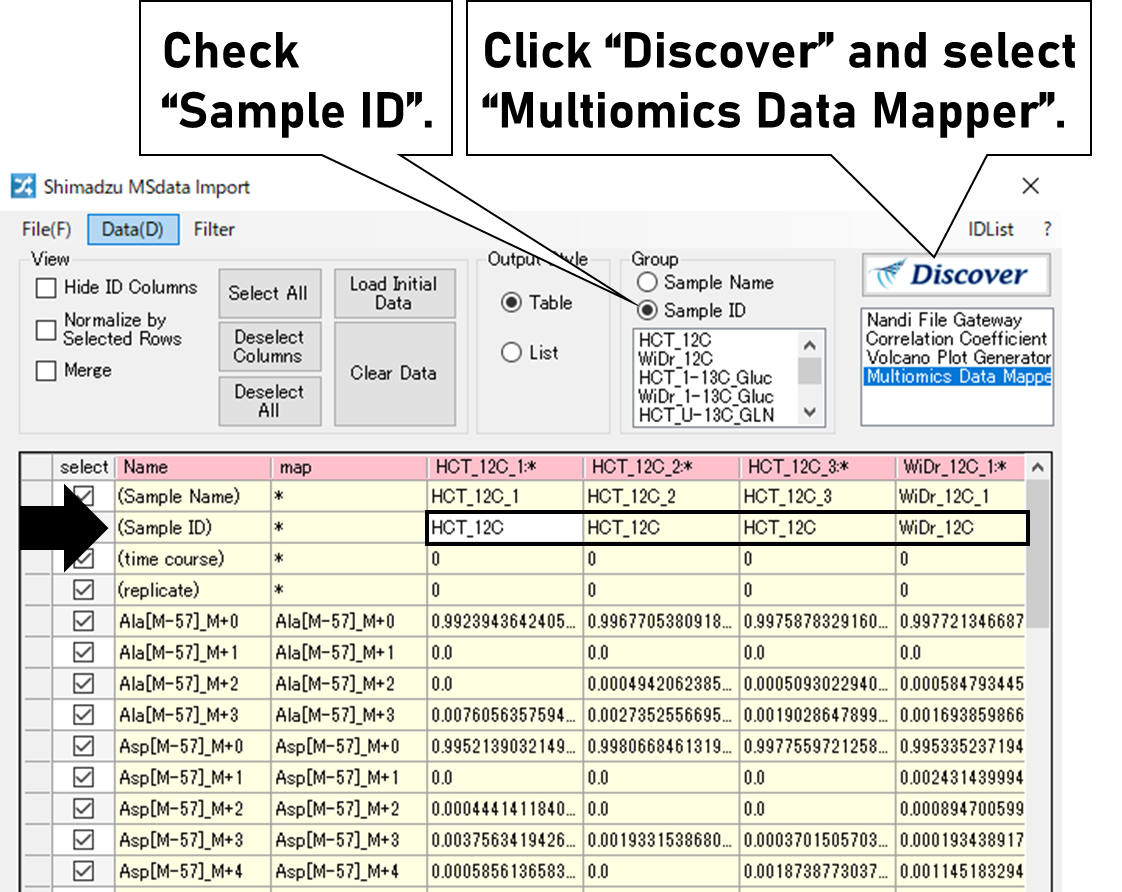
The data will be imported in "Shimadzu MSdata import".
Note:
Fill the names of the sample groups in the sample ID row. Check "Sample ID" in the Group box. Click Discover and select "Multiomics Data Mapper".
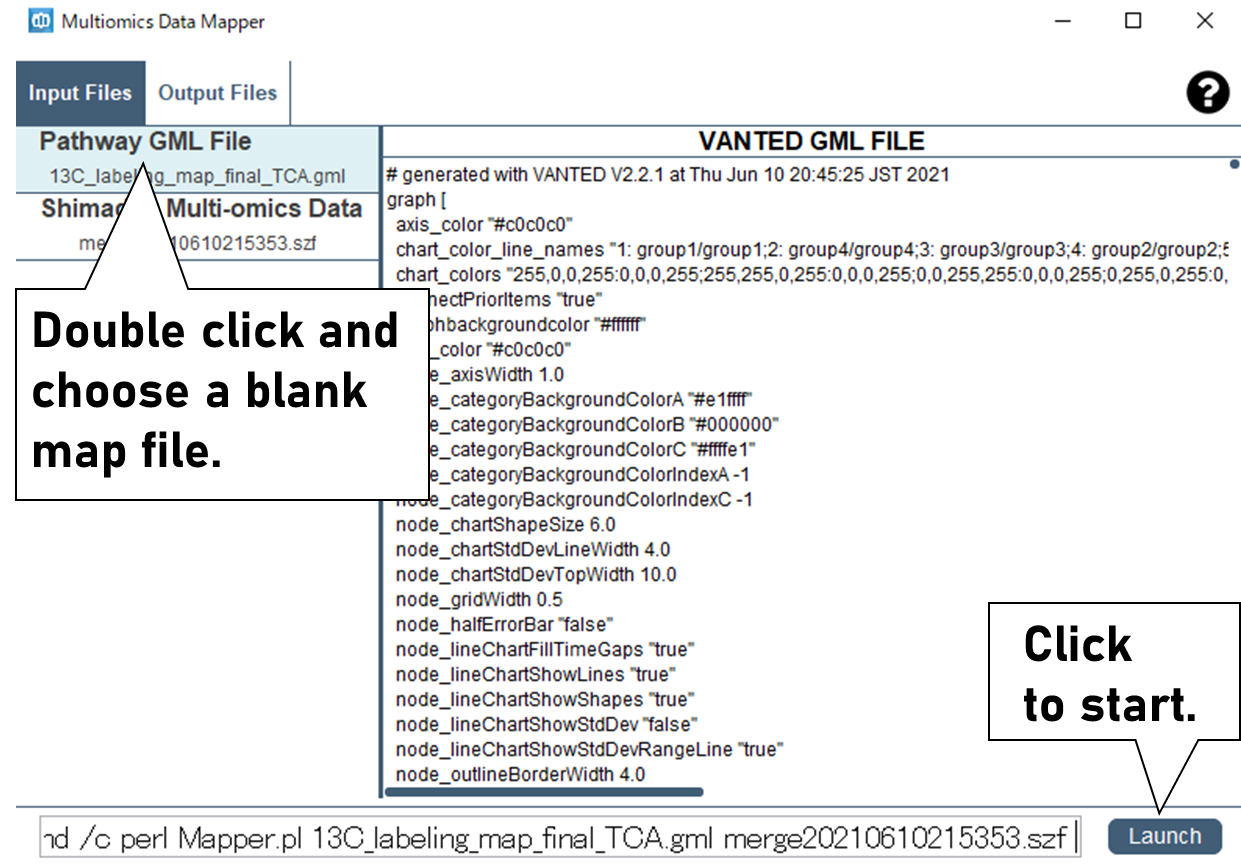
"Multiomics Data Mapper" will start up.
Click "Pathway GML File" and choose a blank map. Then, click the "Launch" button.
Note:
Click the "Disocver" button and select "VANTED".
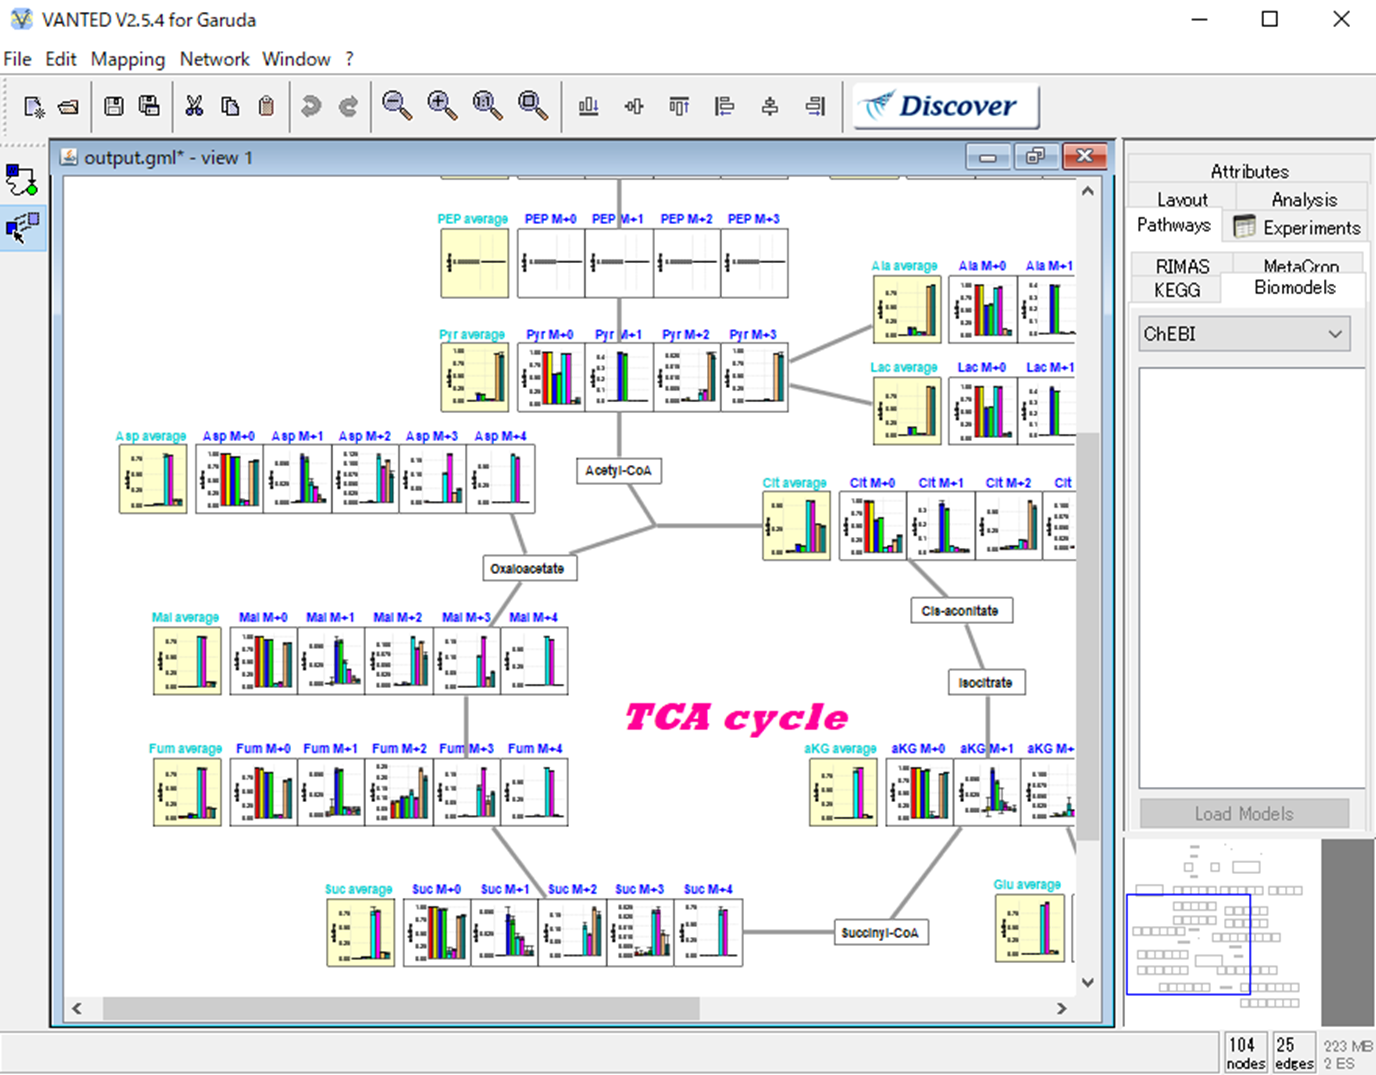
A map with the data visualized will be displayed.
Note:
Saved the map as image. Click "File" > "Export" > "Network as Image", then choose an extension.